

I Was About to Give Up Finding a Bug Until I Actually Installed Laravel Telescope Properly
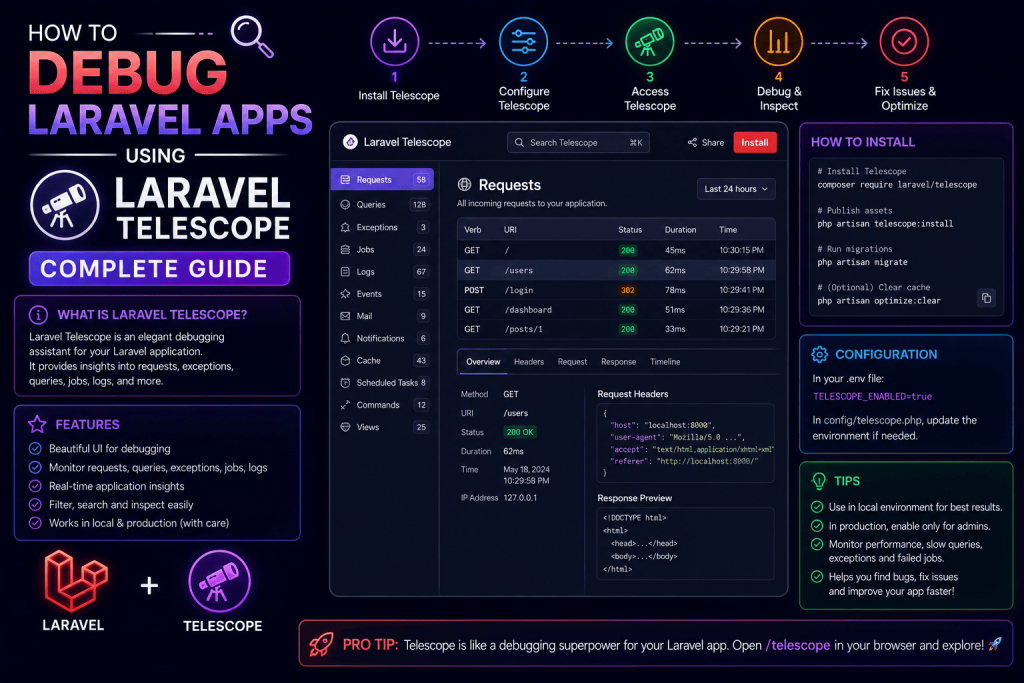
A gym booking app I built had this maddening intermittent bug, sometimes, not always, a booking would go through successfully but the confirmation email just never sent. No error in the browser, no visible failure anywhere, the booking record itself looked completely fine in the database. Just… no email, occasionally, for reasons I couldn’t pin down.
I spent almost two days sprinkling dd() and Log::info() calls all over the booking flow, trying to catch it in the act. Problem is, since it was intermittent, I couldn’t reliably reproduce it on demand, and adding debug statements everywhere felt like fishing in the dark.
A developer friend finally asked me, “Wait, are you even using Telescope?” I’d installed it once on a previous project, poked around for five minutes, decided it looked complicated, and never touched it seriously again. This time, I actually sat down and learned it properly, and found the actual bug within twenty minutes of turning it on.
Turns out a queued job (the one responsible for sending that confirmation email) was silently failing due to a validation error on roughly 1 in 15 bookings, specifically ones where a returning customer’s email had trailing whitespace saved in the database from an old data import. Telescope showed me the failed job, the exact exception, and the exact data that caused it, all in one place, instead of me guessing where to even look.
What Telescope Actually Is (In Plain Terms)
Think of Telescope as a black box recorder for your Laravel app. It quietly logs pretty much everything happening behind the scenes, every database query, every queued job, every exception, every request, every scheduled command, every mail that gets sent, and shows it all in a clean dashboard you can browse through afterward.
Instead of guessing where a problem might be and adding debug statements everywhere, you just open Telescope’s dashboard and look at what actually happened.
Step 1: Installing Telescope Properly
composer require laravel/telescope --dev
I specifically add the --dev flag here, since Telescope is meant for local development and staging environments, not something you want running unrestricted on a live production site (more on why later, since I learned this one the hard way too on a different project).
php artisan telescope:install
php artisan migrate
This publishes the config file and creates the necessary database tables Telescope uses to store all that recorded data.
Once installed, visit /telescope in your browser, and you’ll get a full dashboard immediately, no extra setup needed for basic functionality.
Step 2: Actually Understanding the Dashboard Sections
This is where I went wrong the first time I tried Telescope, I opened it, saw a dozen different tabs, felt overwhelmed, and closed it. Let me break down the ones that actually matter for real debugging work.
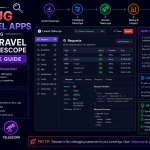
Requests — Every single HTTP request your app receives, along with response time, status code, and the exact route hit. Genuinely useful for spotting slow endpoints. I found a request on that same gym app taking almost 4 seconds once, just by scrolling through this tab and sorting by duration.
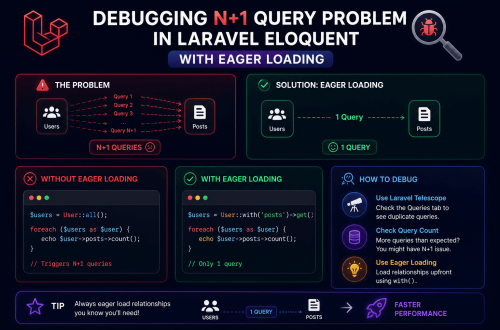
Queries — Every database query run, including the exact SQL, how long it took, and which file and line triggered it. This is the tab that’s saved me the most time overall, especially for catching N+1 query problems I didn’t realize existed.
Jobs — Every queued job, whether it succeeded, failed, or is still pending, along with the exact exception if it failed. This is exactly what caught my email bug, I filtered by “Failed,” and there it was, plain as day, with the exact validation error message.
Exceptions — Every exception thrown anywhere in your app, with the full stack trace, right in the browser instead of digging through storage/logs/laravel.log manually.
Mail — Shows every email your app attempted to send, including a preview of the actual email content, without needing to actually receive it in an inbox. Genuinely useful for testing email templates during development without spamming a real test inbox repeatedly.
Cache — Shows cache hits and misses, useful if you’re trying to figure out why something isn’t being cached the way you expect.
I’d honestly ignore most of the remaining tabs (Gates, Notifications, Redis, Events) unless you’re specifically debugging something related to those areas. Trying to monitor everything at once is exactly what made Telescope feel overwhelming to me the first time around.
Step 3: Using the Queries Tab to Catch N+1 Problems
Here’s a genuinely practical example from a different project, an e-commerce admin dashboard that felt sluggish loading the orders list page.
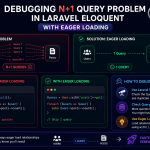
Opening the Queries tab while loading that page, I noticed something alarming, over 200 separate queries fired for a single page load showing just 20 orders. Scrolling through, it was obvious what was happening, a separate query was running for each order’s customer name and each order’s product details, instead of loading them all together.
// What was happening (causing the N+1 issue)
$orders = Order::all();

foreach ($orders as $order) {
    echo $order->customer->name; // separate query per order
    echo $order->product->name; // another separate query per order
}
Fixed with eager loading:
$orders = Order::with(['customer', 'product'])->get();
That single change dropped the query count from over 200 down to 3. Telescope didn’t fix the bug for me, but it showed me exactly where to look, which is honestly the hardest part of debugging most of the time.
Step 4: Filtering and Searching (Don’t Skip This)
Telescope’s dashboard can genuinely get overwhelming on a busy app since it logs everything by default. The search and filter options at the top of each tab are what actually make it usable for a real project instead of just a firehose of data.
For the gym booking bug specifically, I filtered the Jobs tab by “Failed” status, which immediately narrowed things down from hundreds of successful job entries to just the handful that actually failed, making the actual problem obvious within a couple minutes of scrolling.
You can also filter by specific date ranges, useful if a client reports “this happened around 3pm yesterday” and you want to jump straight to that window instead of scrolling through everything.
Step 5: Setting Up Telescope Safely (The Mistake I Made Once)
Here’s a genuinely important lesson from a different, slightly stressful experience. On an earlier project, I left Telescope’s default configuration completely open on a staging server that was, embarrassingly, accessible publicly since I hadn’t properly restricted access. Telescope’s dashboard shows a LOT of sensitive information by default, including full request payloads, which can include passwords, tokens, and other sensitive form data if you’re not careful about excluding them.
Telescope’s TelescopeServiceProvider has a gate() method specifically for controlling who can actually view the dashboard:
protected function gate()
{
    Gate::define('viewTelescope', function ($user) {
        return in_array($user->email, [
            'yourEmail@example.com',
        ]);
    });
}
This restricts dashboard access to specific authenticated users only, which I now set up as one of the very first things I do after installing Telescope on any project, not an afterthought.
For production environments specifically, I generally recommend either not installing Telescope at all (since it does add some database overhead recording everything) or, if you genuinely need it in production temporarily for debugging a live issue, making absolutely sure it’s gated properly and ideally disabled again once you’re done.
TELESCOPE_ENABLED=false
This environment variable lets you toggle Telescope on and off without removing the package entirely, useful for temporarily enabling it in production for a few hours while chasing down a specific live bug, then switching it back off.
Step 6: Pruning Old Data (Something I Forgot Until My Database Got Bloated)
Telescope records a LOT of data, and if you leave it running for weeks without pruning, that data adds up fast. On one project, after about three weeks of active development with Telescope running constantly, the telescope_entries table had ballooned to a genuinely surprising size, several hundred thousand rows, most of it entirely useless historical data I’d never actually look back at.
Laravel gives you a built-in command for this:
php artisan telescope:prune
By default, this prunes entries older than 24 hours. You can adjust this:
php artisan telescope:prune --hours=48
I’d recommend scheduling this to run automatically rather than remembering to do it manually, which, realistically, nobody actually remembers to do consistently:
Schedule::command('telescope:prune')->daily();
Real Example: How I’d Approach a New Bug With Telescope Now
If I’m handed a vague bug report today, something like “sometimes this feature doesn’t work right,” here’s roughly how I use Telescope to actually track it down:
First, I check the Exceptions tab, filtering by roughly the timeframe the bug was reported in, to see if anything actually threw an error during that window. If nothing shows up there, I check the Jobs tab next, since a lot of “silent” failures in Laravel apps happen inside queued jobs that fail quietly in the background without surfacing an error to the user at all. If that’s also clean, the Queries tab often reveals something unexpected, a query returning null when it shouldn’t, or simply not running at all when you’d expect it to.
This systematic approach, checking Exceptions, then Jobs, then Queries, has replaced almost all of my old habit of sprinkling dd() calls everywhere and hoping to catch something.
Common Mistakes I’d Warn You About
Installing Telescope but never actually restricting dashboard access. This is a genuine security risk if left open, especially on a staging environment that’s technically publicly reachable.
Leaving Telescope running indefinitely without pruning. Your database will quietly grow far bigger than necessary if you forget this.
Trying to monitor every single tab constantly instead of focusing on what you’re actually debugging. Telescope shows a lot of information, and trying to absorb all of it at once is overwhelming. Focus on the tab relevant to your actual problem, Jobs for background task issues, Queries for performance issues, Exceptions for actual errors.
Running Telescope on a genuinely high-traffic production app without considering the overhead. Recording every single query and request does add some database load. For smaller apps this is negligible, but worth being aware of on anything with serious traffic.
Forgetting Telescope exists once installed. This was genuinely my own mistake for the longest time, installing it, poking around once, then completely forgetting to actually use it during real debugging sessions.
Final Thoughts
That gym booking bug would’ve taken me a lot longer than twenty minutes if I’d kept relying on scattered dd() calls and hoping to catch an intermittent issue in the act. Telescope essentially gives you a recorded history of everything your app actually did, which turns debugging from “let me guess where the problem might be” into “let me just look at what actually happened.”
If you’ve installed Telescope before and, like me the first time, found it a bit overwhelming and abandoned it, give it another proper try. Focus on just the Requests, Queries, Jobs, and Exceptions tabs to start, and you’ll likely find it becomes one of those tools you genuinely can’t imagine debugging Laravel apps without once it clicks.